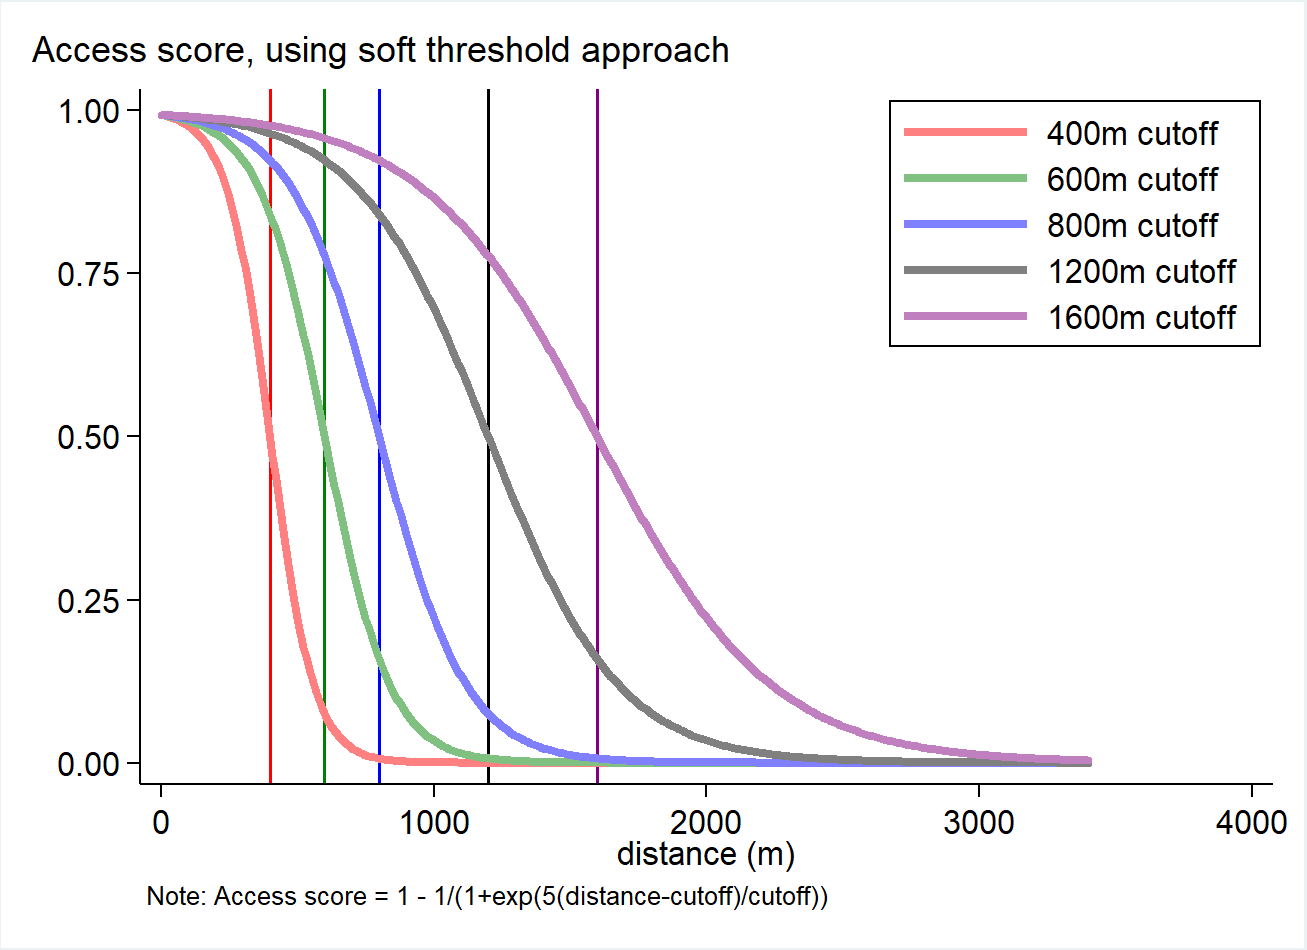



    Accept Cookies

    Please accept Cookies, Terms of Use and Privacy Policy to continue.

    Terms of Use

    Privacy Policy

    Please select a city...

    ×
    The Observatory hosts sets of indicators for cities around Australia. Please select a city and year from the drop down menus in the upper left of the screen to load and view the available indicators for that region and timepoint.

    Satellite basemap

    ×
    The satellite base map layer is useful for evaluating the geographic context of a region.

    Basic topology basemap

    ×
    The basic map layer provides a simplified view of the region's topology.

    Reset Password

    ×

    Sign in

    Remember MeForgot password?

    Register

    Sign In

    Register

    ×

    All liveability indicators for Local Government Areas are provided for free with registration.
    Only our Liveability Index and Social Infrastructure Index are available free at the neighbourhood level without a Funding Partnership.

    Reset Password

    ×
    Please re-enter your details to reactivate your account.

     Destination access

    ×
    Binary indicators of destination access were based on current urban policies or the literature if urban planning policies did not exist. While binary indicators are a natural way to express whether a policy has been achieved (or not), it is not intuitive that, for example, living within 390m from a bus stop gives a person full benefit of this proximity while living at 410m the resident receives zero benefit. This binary threshold can be referred to as a 'hard threshold', in contrast to 'soft threshold' indicators calculated using a logistic decay function yielding for each destination type a continuous access score ranging from 0 to 1.
    

    HomeContact
    Change map mode
    Logout

    Please select a map view mode.

    Percentiles

    ×

    Percentile scores enable a comparison of a selected area to other results in the AUO and influence the calculation of deciles shown in the maps. These percentiles can be presented at 3 different levels.

    • National level percentiles provide a comparison of the selected area, to all cities included in the AUO (at the same level of geography).
    • City level percentiles provide a comparison of the selected area to all areas included in the relevant major city.
    • Local Government level percentiles provide a comparison of the selected area to all areas included in the relevant Local Government Area.